Volume Spread Analysis ( VSA)


Volume Spread Analysis: Now we have learnt a little about candles, and what is called technical analysis, we are going to combine this knowledge with our main online trading indicator, which is VOLUME, and cover a topic called Volume Spread Analysis. Volume is like the water in a hose pipe, and the greater the water pressure, the more powerful the flow. So where we have a stock or forex candle with a wide body we expect to see high volume. It takes effort to move downhill as well as up, so if you see a wide body down candle with low volume then you know this is a false move and you are being led into a trap by the professional traders.
They are simply trapping traders into thinking prices are falling - do not be drawn in to the trap down move - prices will go back up very quickly once the market makers have shaken a few trees and bought enough stock at low prices. The study of candlesticks when combined with volume, is called volume spread analysis.


This is the stock chart for Hanson plc, and is taken over a 5 month period, with each candle representing a day's price movement. The up thrust we are going to look at is that on the 15th March. It is an unusual up thrust ( 15th March ) as the wick is very long, however it does demonstrate the principle rather well so I thought it would make a good example. As you can see prices have been rising steadily when suddenly a huge up thrust occurs, which should set the alarm bells ringing. Look at the volume underneath it is 5 or 6 times the normal volume for the share. Something odd is happening. The professional money is selling heavily, trying to keep prices up whilst they try to dump shares on the unsuspecting.( lots of effort with no reward - danger ! ) They are constantly overwhelmed by selling coming onto the market. The bears have won this battle and there could be a change. Note that this does not take effect immediately. We monitor candles for the next few days to see if weakness appears, which it does with another upthrust 5 days later, this time on lower volume. Prices start to move downwards, eventually falling sharply in Mid May.
Our analysis is therefore that after this first sign of weakness then wait for a further confirmation signal, which comes 5 days later, confirming that there is weakness in the market. Based on these two candles we would take a short position, with an expectation of prices falling in the next few days. Now, what this analysis can never tell you is how large the move will be or how long it will last. The exit point for your trade is down to experience, and an analysis of the candles for possible turning points in the opposite direction! This is what volume spread analysis is all about - giving you an insight into what is actually happening in the market, and more importantly what is likely to happen in the future!

OK, let's look at another example. Here again, you can see the upthrust in mid May. Notice how in this example, the opening price on the bar, is higher than the closing price on the bar the night before. We call this 'gapping up' and occurs where there is a gap between the closing price of one bar and the opening of the next. The professional money has 'gapped the prices up' to add to the impression that prices are going up! The upthrust sits 'suspended' above - this is another classic sign. The volume has increased although not as marked as in the previous example. However with increased volume and an upthrust that has been 'gapped up' we should be cautious. This is followed by a down bar and in the following down bars, volume increases as we would expect ( increased effort both going down and up ) - the down bars are wide with volume in line with what we would expect to see - we therefore assume that prices are going to fall.
Now it is important to note that in technical analysis using charts and volume, we are NOT trying to predict tops and bottoms ( nobody can, but many have tried). What we are doing is looking for possible turning points, then waiting for confirmation before we do anything. Once the move has been confirmed we may then decide to trade. What it also does not tell us is the length of the move, which could last days, weeks or months. This is why we have strict money management controls in place, just in case we are wrong or the move only lasts for a short time and then continues in its original direction.

Volume Spread Analysis - The Downthrust


Now that we have looked at the upthrust, lets take a look at its sister the DOWNTHRUST. Towards the end of March, we have two downthrusts, one after another. Note the high volume of the first one ( blue ) which is huge, suggesting that the professional money has definitely entered the market and is buying into the market. The bulls have overcome the bears and stopped prices falling. This is followed by a second, still on high volume. We wait for confirmation, and within a few days prices start to rise. Note that at mid May there is an upthrust but on relatively low volume. Upthrusts and downthrusts can occur on low volume - it is a trap move by the professional money and could therefore be a false signal. You just have to try and interpret what is happening. However, high volume is generally a giveaway signal that this is a true signal.

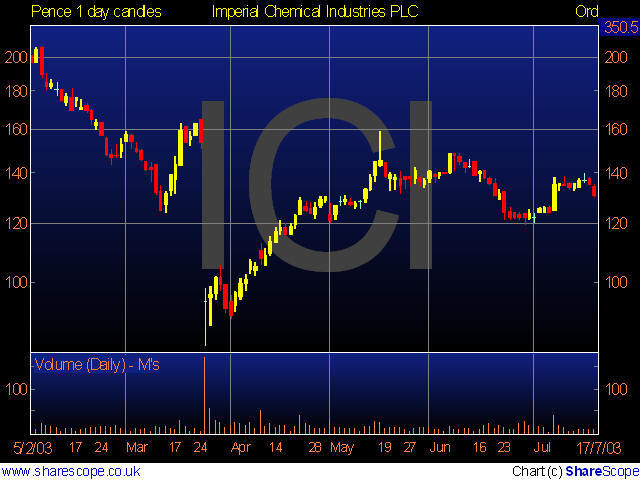
Volume Spread Analysis - Look For The Abnormal


The last example will hopefully make the point about volume in general and is simply this - that when you see abnormally high or low volume, something is happening, and you need to investigate further by analysing your candles. Have a look at the following chart which I hope will give you the idea. What I would like you to look at here is the 6 days of volume around mid-March at the 180-190 price level - lots of volume with no corresponding increase in prices ? Clearly there is something wrong here so we need to wait and see. Is it possible that the professional money is selling into the higher prices before prices fall ? More than likely! Note the wide spread bars on the way up have corresponding high volume so at this stage everything looks OK. volume = effort =results.
In summary, these are the sorts of questions that you will start to ask yourself once you start to study charts on a regular basis. There are many candle formations and types that you need to learn and understand and all I can do here is to try to introduce the concept and some basic ideas which I hope has given you a basic understanding of the subject, and that the combination of candles and volume can give a real insight into what is happening in the market. Much of your analysis will be common sense and it will not always be right - you have to accept that there is no perfect method to trade, but the above is based on good common sense and the only indicator the insiders cannot hide, and that is volume. Analysis of candle charts can be very revealing and worth the effort - believe me! - your trading will take on a new dimension as you start to read the markets whether they be in stocks, options, currency, futures, or indeed anything else.

Why Demo Account Performance Is Often Better Than Real Account Performance?


 Over the past several years, the popularity of online currency trading has grown substantially. Each day, online FX brokerage firms attract new investors - each of them lining up with a glint in their eye, lured in by promises of easy money. Most of these companies allow you to sign up for a free demo account which lets you place mock trades using their trading platform to get a feel for the excitement of currency trading. 


In the casual world of free demo accounts - many young traders find they are able to garner impressive profits without a significant amount of effort. It almost seems too good to be true. But transferring this success from a demo account to a real account is far less common. Why is this?

The actual trading platform behaves the exact same way, the market doesn't care whether you're a demo or real trader - so what is different? It's you who has changed. Not your personality, not even your trading style - but the factors that affect you are different.

What is the key factor to trading success?

The search for the "Holy Grail" of trading has been a common theme throughout the history of markets. There are a variety of different techniques. Those whom are inclined towards number crunching and pattern recognition may prefer technical analysis, whereas those more focused on the big picture, logical macro perspective prefer fundamental analysis. Then there are specific methodologies like swing trading, trend following or even more esoteric ideas like the Elliot Wave theory. Which one is best? There are examples of very successful traders using each methodology.

Since most new traders lose money - perhaps the more appropriate question to ask is, "What is the key factor to trading failure?"

Greed and Fear
 
Trading is an atmosphere rich in the porous emotions of greed and fear. The current price of a given security or financial instrument at any point in time can be thought of as the confluence of greed (bulls) and fear (bears). These two emotions make up the core of humanity itself. When market information is released, trading can be a high intensity experience. Sensing danger, your body releases adrenaline that acts to accentuate both your greed (fight) and your fear (flight). Because these emotions are so strong, they can cause you to act irrationally, ignore your system, stated set of rules or trading plan and to act upon impulse. Indeed, this is a genetically programmed response - but it is often also the trader's downfall, especially when he's playing with much better capitalized, more sophisticated and experienced foes that know how to manipulate those emotions.

When you are a trader - you are always under the influence of at least one of these two emotions, even if you don't have any trades on.

Impact of fear and greed on your trading

If the market's going up and you're in - greed is telling you to buy more and fear is telling you to take your profits while you still can. If it's going down, fear of being wrong makes you hold onto a losing position - and then greed sometimes convinces you to "average down" your position (and buy more) so it'll be easier for you to come back.

If the market's going up and you're not invested - fear is telling you that you're missing out on easy money but it's your greed that causes you to get in just after the greatest increase (just when its about to reverse course). If the market's going down and you're not invested - greed is telling you to get in as the price is cheap, while fear reminds you that you'll miss out on this opportunity if you don't act quickly.

Perhaps if we just felt greed, or just felt fear we would be able to control our emotions a little better. But when both of these little devils whisper into our ears at the same time - it is often impossible not to listen.

The Thrill of Greed
 

The first time you try FX trading - you will feel the thrill of greed. It is an ecstatic experience, your brain flush with neurotransmitters and your mind giddy with visions of untold riches about to be reaped. Greed is bold, aggressive and incredibly exciting. It can take hold of you both mentally and physically. Just imagine the possibilities!

This greed is what draws us into FX trading in the first place - the dream of easy money and 100:1 or 200:1 margin rates. It inspires us and causes us to forego rational thinking in favour of reckless abandon.

In the movie Wall Street, Gordon Gecko says, "Greed is good", but it is also very dangerous - especially if you are unable to recognize when greed is the one doing the talking. Greed is also one of the most common techniques used to manipulate people. Every get rich quick scheme, promising untold riches for no money down takes advantage of your natural predisposition to throw all logic and sense out the window when greed pays a visit. The argument starts to appear very compelling and you ignore what would otherwise be clear warning signs. Like drunk goggles, greed can mislead you and when you eventually wake up you are often in a very precarious position.

The Fear of Losing
 

Fear can be equally as dangerous. The most potent and easily manipulated form of fear is your fear of admitting that you are wrong. Fear of having your precious ego bruised. This fear can cause people to do incredibly stupid things. The funny thing about this world is that everyone thinks that they are right. Most people would rather lose thousands of dollars than admit they are wrong. It is easy to feel ashamed of trading losses and live in denial but this is self-destructive behaviour. By denying the problem exists, you fail to take steps address it and only ensure that it will continue in the future.

Demo Trading
 

Demo trading is a great way to get started in foreign exchange trading. It is identical to real trading, except that you're using "pretend" money. Demo trading allows you to get a taste for what type of events move markets and how they move. It encourages you to learn more about geopolitics, macroeconomics and global finance and these are all incredibly positive things.

Demo trading also introduces you to the rapture of greed. Trading is a means to one of the purest, most raw and potent forms of greed. The whole point of trading is to make money and the more money you make - the stronger the pull of your greed becomes. It is intoxicating and can take complete control of you.

But demo trading does not introduce you to fear. There is no fear when you are demo trading. It is like you have a perpetual get out of jail free card. If you start losing badly on a demo account - simply start a new one. There is no accountability for your trading failures and only recognition of your trading success.

So your demo account does not teach you how to handle the emotion of fear. This emotion is most likely going to lead to your downfall. Greed may get you overextended, but fear will stop you from cutting your losses. You may think that fear of losing money would cause you to cut your losses, but the stronger emotion is fear of being wrong and that causes you to hold on to your losing position - until it's all gone.

There is also the issue of account size. Many demo accounts give you $50,000 to play with. This type of capitalization allows you to buy 5 lots (500K) of EURUSD pretty easily. If goes up 20 pips you've made $1000. Nice one. But when you open your real account - it's more likely that you put $5000 or $10000 in there to begin with. Now you're dealing with a 50K lot, which means you'll take $100 out of a 20-pip movement. But mentally you are used to getting $1000 for that movement so you usually end up risking more. Next thing you know - your 200K position has turned against you 50 pips and you've lost $1000. That's real money you just lost. You can't just start another account.

The capitalization of the demo account is sufficient to sustain losses and still come out on top. But your real account is likely to be undercapitalized and if you're trying to achieve returns similar to what you got on your demo account - you are going to blow up very quickly.

Being honest with yourself
 

Ultimately, while providing an excellent introduction to FX trading - demo accounts do not accurately predict whether you'll be successful trading real money. Markets are dominated by psychology and often go against what fundamental logic or technical indicators suggest should happen. The single most critical factor in your trading success will be your ability to control your emotions of greed and fear. These emotions cloud your judgment and cause you to trade recklessly. Demo accounts introduce you to the emotion of greed, but by their very nature they are risk free and therefore there is no fear involved. They are also likely to be better capitalized than your real money account, which misleads you with respect to the amount of returns you can expect to earn.

For all of these reasons, demo accounts allow you to avoid being honest with yourself and this is perhaps the most important factor of all. You need to know your edge and your limits and in order to know these - you must be honest with yourself.

This being said, demo accounts are still very entertaining and educational and I highly recommend opening one to anyone who's interested in getting a taste of the exciting world of FX trading. It's a great way to learn more about economics, global politics and yourself.


Written by WCFOREX       

High-frequency World In The Forex Market


High-frequency trading (HFT) is a new sophisticated type of trading that involves supercomputer power and ultrafast algorithms, which solve the price action and the news-feed in a matter of microseconds. It arises firstly in the stock market, where a lot of algorithmic trading desks exploit the order flow inefficiencies and compete for the bid/ask spread in a broad range of actively traded stocks. In 2010 over 70% of the US equity trading volume is considered to be driven by these algorithmic strategies. But what is the situation in the forex market? Is there anything similar or not? We will discover in this paper that in forex this segment of the active trading participants grow very fast and soon will determine the rules in the whole market!

High-frequency trading (HFT) is the use of sophisticated technological tools to trade securities like stocks or options, and is typically characterized by several distinguishing features:
- HFT is highly quantitative, employing computerized algorithms to analyze incoming market data and implement proprietary trading strategies;
-HFT usually implies a firm holds an investment position only for very brief periods of time - even just seconds - and rapidly trades into and out of those positions, sometimes thousands or tens of thousands of times a day;
- HFT firms typically end a trading day with no net investment position in the securities they trade;
-HFT operations are usually found in proprietary firms or on proprietary trading desks in larger, diversified firms;
-HFT strategies are usually very sensitive to the processing speed of markets and of their own access to the market.

In high-frequency trading, programs analyze market data to capture trading opportunities that may open up for only a fraction of a second to several hours. High-frequency trading (HFT) uses computer programs and sometimes specialised hardware [3] to hold short-term positions in equities, options, futures, ETFs, currencies, and other financial instruments that possess electronic trading capability. High-frequency traders compete on a basis of speed with other high-frequency traders, not long-term investors (who typically look for opportunities over a period of weeks, months, or years), and compete with each other for very small, consistent profits.  As a result, high-frequency trading has been shown to have a potential Sharpe ratio (measure of reward per unit of risk) thousands of times higher than the traditional buy-and-hold strategies. By 2010 high-frequency trading accounted for over 70% of equity trades taking place in the US and was rapidly growing in popularity in Europe and Asia. Aiming to capture just a fraction of a penny per share or currency unit on every trade, high-frequency traders move in and out of such short-term positions several times each day. Fractions of a penny accumulate fast to produce significantly positive results at the end of every day. High-frequency trading firms do not employ significant leverage, do not accumulate positions, and typically liquidate their entire portfolios on a daily basis.

One financial industry source claims algorithmic trading, including high-frequency trading, substantially improves market liquidity. An academic study shows additional benefits, including lowering the costs of trading increasing the informativeness of quotes, improved linkage between markets,  and other positive spillover effects, at least in quiescent or stable markets; the authors of this study also note that "it remains an open question whether algorithmic trading and algorithmic liquidity supply are equally beneficial in more turbulent or declining markets...algorithmic liquidity suppliers may simply turn off their machines when markets spike downward. Also noteworthy is that HFT only takes place in markets that are already deemed liquid, hence calling its necessity into question.
Algorithmic and high-frequency trading were both implicated in the May 6, 2010 Flash Crash, when high-frequency liquidity providers were in fact found to have withdrawn from the market. A July, 2011 report by the International Organization of Securities Commissions (IOSCO), an international body of securities regulators, concluded that while "algorithms and HFT technology have been used by market participants to manage their trading and risk, their usage was also clearly a contributing factor in the flash crash event of May 6, 2010." 

The HFT firms in the forex market operate with small trade size, but very large volume of transactions. The typical period of holding the open position is very short, approximately less than five seconds and often under one second. In the forex market the HFT is a bit slower than in the equity market, because the market is decentralized and the liquidity is aggregated from all over the world, so the speed of light is the limit in order execution. In most cases this means several milliseconds. Typically the time for trade execution is 10 to 30 milliseconds, but in some cases it is as little as one millisecond.
There are several benefits from the operation of HFT firms in the forex market, but the most important of them is that HFT helps for the distribution of the liquidity across all the market places, thus improving the efficiency of the market itself and help for narrowing spreads.
There are a broad range of strategies, which are involved in the HFT. Some of the more classical ones are:

Arbitrage between three or more pairs (for example EUR/USD, USD/GBP and EUR/GBP). This strategy is well known for decades, but now it is exploited by ultrafast algorithms, which could see the arbitrage opportunity and execute it in a matter of several milliseconds.
- There are a number of strategies that are involved in a direct liquidity providing, thus aiming to capture the bid/ask spread. These are a market making HFT strategies.
-Some players in HFT use latency arbitrage strategies, aiming to gain from the slower price change in the platforms of some market makers, compared to other platforms.

 In the last years it arise a full range of new and more complex strategies that utilize more sophisticated algorithms to process complex events and follow a lot more market indicators. They use statistical models for price momentum, mean-reversions, correlations between pairs and also with other assets, like bonds and futures. There are even some strategies that process news information and economic data and could react very quickly to it.  Most of the HFT participants are prepared to work in most liquid markets, like the major currency pairs in low volatility conditions, but some of them are prepared also for the volatile market conditions.

The platforms, which are mainly used by the HFT participants, are ECNs (electronic communication networks), which aggregate liquidity from multiple banks and dealers. An example of such an ECN is the Dukascopy Swiss FX Marketplace, which combine liquidity from biggest marketplaces (Currenex, Hotspot FX, Lava FX) and banks in the world (Bank Of America, Deutsche Bank, JP Morgan, UBS, Goldman Sachs, Citibank and a lot more). In such an environment it is very easy to compete with other participants and to implement your strategy. In comparison with old interdealer providers, which often restrict the number of price quotes per second, in ECN environment there is no such restriction, because it can handle a big amount of data through its APIs and messaging standards (like frequently used FIX protocol).

The other important thing for starting a HFT venture is to have access to tick history data, in order to backtest and check the functionality of your HFT algorithms. In my opinion Dukascopy Bank is the one of the very few, if the only one forex prime broker, providing such a valuable information for free! Thus for me it is a place to start a HFT venture. In some of my future articles I will discuss more in depth the algorithms and their implementation in order to have a fully functional HFT, which is one of my big dreams!


Losses Are A Part Of Trading


Can you name a great trader who has never had a losing trade? Losses are a part of trading. I remember hearing Van Tharp say that a loss is to trading what breathing out is to the breathing cycle.
It is not unusual for new traders to have difficulties in taking losses. After all, losing is not something to be desired in most areas of life, so why in trading? We are generally conditioned culturally to aim for very high percentage success rates; in exams, high percentage scores are required to achieve the best grades. But in trading you could be very profitable with a 40% winning percentage; indeed, you could even be amongst the top earning traders. There are not many exams where you can get top marks with 40%.

Learning to Take a Loss
Good trading is not about being right, it is about trading right. If you want to be successful, you need to think of the long run, and ignore the outcome of individual trades.” – Curtis Faith, Way of the Turtle

There are lots of different strategies and approaches that you can use to help you to take and deal with losses more effectively. Ultimately your beliefs and attitudes  around  what  a  loss  means  will  have  the  biggest  impact  to  you.  I remember working with one trader who saw a loss as a failure, a setback and a waste, and combined with his perfectionist tendencies this made taking any kind of loss a real challenge, and emotionally quite painful and difficult. But  once  he  had  challenged  those  old  beliefs  and  made  the  decision  to  see losses as being a part of the trading experience: – something to learn from, - and had made the distinction between a losing trade and a bad trade, then his ability to take losses, and to deal with them, dramatically improved.

“Resilience is essential; again it isn’t so much how well you deal with success in trading it is how you deal with problems (and there will be a lot of them). When I trade it isn’t the financial side of the loss I find difficult, it is when the trade proves to be right and you have paid up or down which is the biggest frustration. I would advise, as I am starting to learn now, you are better just to forget about it and move on – there is always another day.” 

“Dealing with losses can be hard. Try to analyse them in an objective way. Working out what went wrong will help you to feel that you have the power to prevent it next time. This will give you the belief that you have come through a better trader, and this will help greatly with the healing process.”


“To always remember to step back and look at the big picture, where the decisions of a current trading day, or even a trading month, are merely a fragment of an overall plan of action. In that way, the trader’s bankroll can be managed effectively, the psychological effect of losses can be overcome more easily, and the trader would find less need to gamble for the one big trade, when he/she is aware of the positive effect of consistent accumulation.”


“I think one of my strengths is that I view anything that has happened up to this point to be history. I really don’t care about the mistakes I made three seconds ago in the market. What I care about is what I am going to do from the next moment on.”

By SixStringGuy  on Forex Article

Comment